to display the change in flooded/drained coastal area with changing sea levels
| basics |
Google
Earth® (GE) allows
to place any picture on Googles Earth using the
Image Overlay function. Placing a small monochrome
image and stretching it over the whole world, is a
simple way to create either a horizontal layer or
a layer parallel to the surface. |
||
| A
simple way to show the effects of a changing sea level
in Google Earth |
This example
file shows where the coastline was when sea levels
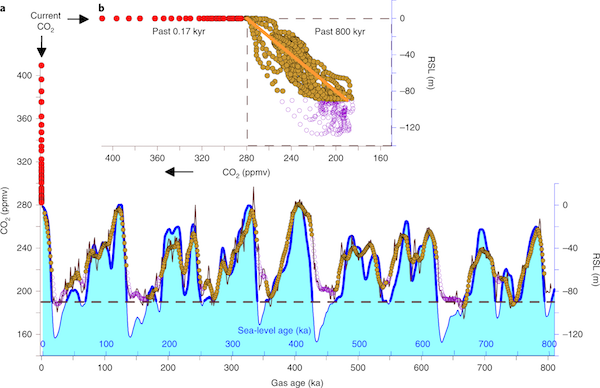
were 50m less than today (approximately 10,000 years (=10 ka) ago, also about 100 ka ago - compare sea level curve below. quick and dirty 1. Set layers terrain: on 2. Preferences - 3d view : vertical exaggeration: 1 3. Terrain quality: high NOTE: you have to zoom in quite far !!! Google uses a DEM model which changes with zoom level it is very coarse and things look horrible if you are zoomed out but calculating terrain is fast. to change sea level to be displayed: right click on downloaded SEA LEVEL element in "Places" click on Get info Altitude - absolute - 50m = 50m less than today (e.g. MIS 5d) (default as downloaded) - 125m = 125m less than today (e.g. MIS 2 / LGM ) + 6 m = 6 m more than today (e.g. MIS5e / LIG) Link to file - could be any picture file on your computer or online simply a picture file that gets stretched over the whole world I use a 16x16px PNG file which is just white https://www.sedgeochem.uni-bremen.de/colors/white.png you can also download it - then link to the file "white.png" on your computer I then set the color directly in the kml file currently - 75FF0022 for a nice blue - syntax - oobbggrr oo - opaqueness from 00 to FF - DD is almost opaque could be changed through "Get info" - transparency bb - blue value - from 00 to FF - change only directly in kml gg - green value - from 00 to FF - change only directly in kml rr - red value - from 00 to FF - change only directly in kml THATS IT looks pretty good when zoomed in enough. If you choose altitudeMode - relative to ground you create a layer parallel to the surface - also interesting maybe. |
minimum kml file for placemarks multiple placemarks in one file defining buildings in a kml file fix if kml-files from your server do not open in GE watch and play route in Google Earth fix
if Google Earth does not connect to server
|
|
| Example kml file syntax | <GroundOverlay> <name>SEA LEVEL - 50m </name> <open>1</open> <LookAt> <longitude>-7.0</longitude> <latitude>34.0</latitude> <altitude>0</altitude> <heading>-0</heading> <tilt>0</tilt> <range>25000</range> <gx:altitudeMode>relativeToSeaFloor</gx:altitudeMode> </LookAt> <color>75FF0022</color> <Icon> <href>https://www.sedgeochem.uni-bremen.de/colors/white.png</href> <viewBoundScale>0.75</viewBoundScale> </Icon> <altitude>-50.00000000000001</altitude> <altitudeMode>absolute</altitudeMode> <LatLonBox> <north>90</north> <south>-90</south> <east>180</east> <west>-180</west> </LatLonBox> </GroundOverlay> |
-
opener to overlay image - name of layer - 1 opens at program start - LookAt (not necessary) parameters that define where google earth view is centered when the Overlay is double clicked (not important) All but the layer color maybe defined when you right-click and choose Get Info color of the layer (blue - only manual edit !) link to image file to be displayed I use a tiny 16x16 px white png image. zoom level 0.75 - 75% of screen is overlay altitude of layer: -50 is 50m below sealevel absolute means above/below sea level <LatLonBox> here I stretch image over the whole world from 90°S to 90°N and from 180°W to 180°E close Ground overlay description |
|
| Example
screen shot from Google Earth with sea level layer
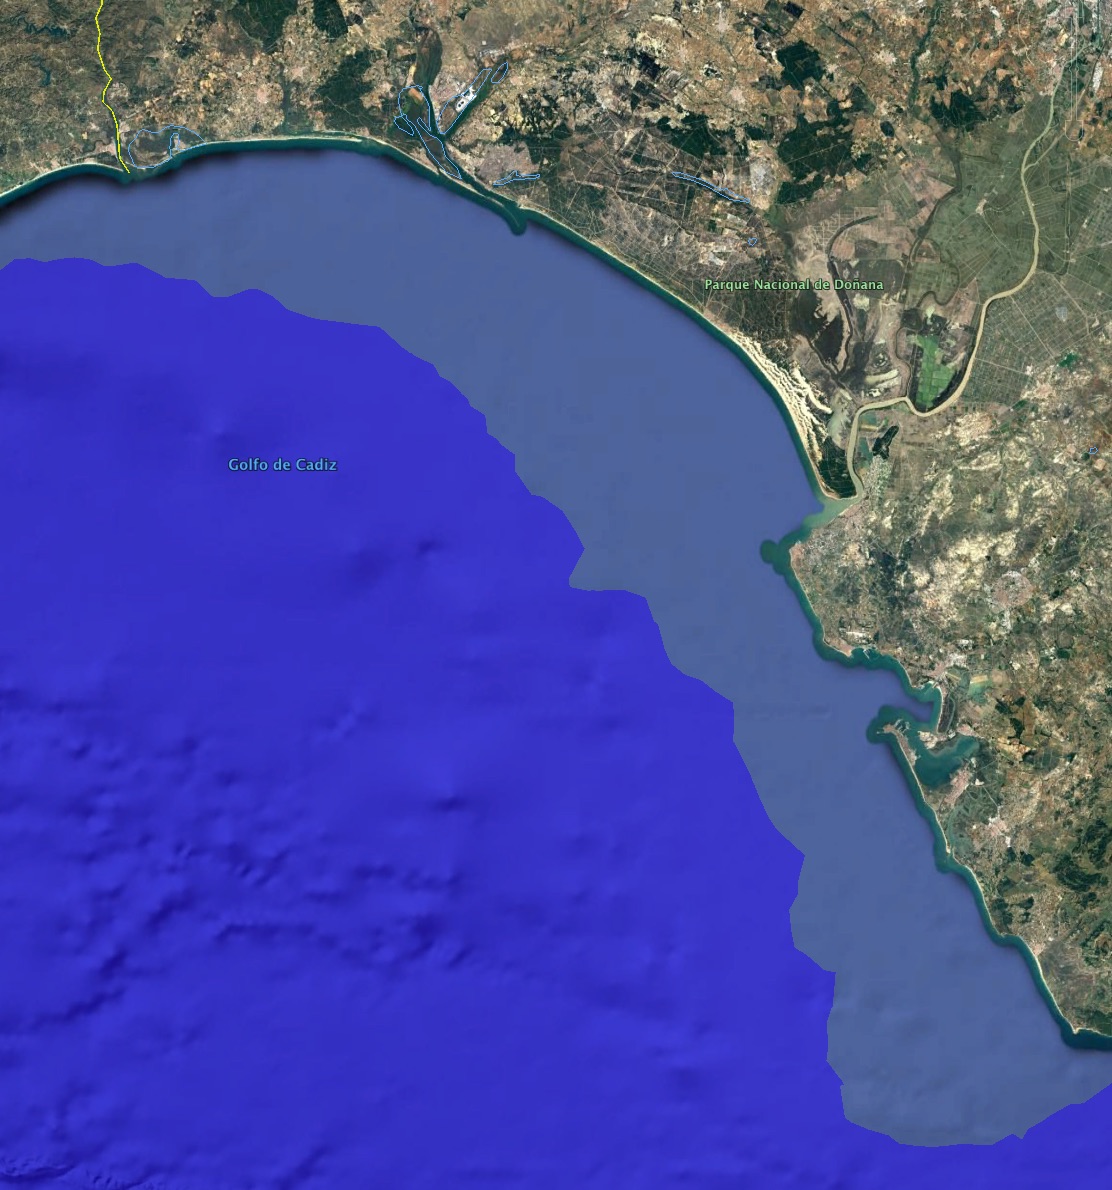
switched on Gulf of Cadiz coastline at a sea level of 50m less than today - so everything that is light blue was still coastal land and today's coastline was 50 m above that sea level. -50m is the sea level about 10.000 years ago (10 ka ago) - compare also the sea level - CO2 graph below) |
 |
The
horizontal layer (deep blue, slightly transparent)
intersects with the Google Earth surface wherever it
gets higher than 50m below current sea level. So it covers everything that is less than 50m below sea level You can also overlay several layers like this with different heights (you will have to manually change the colors so you see different layers Again: unfortunately this gets very imprecise if you zoom out quite far. This is because google uses higher resolution elevation grids only as you zoom in, otherwise it would take ages to display terrain. Still this is a very simple and fast way to plot approximate coastlines with both higher or lower sea levels than today Klick on image to download or open example file in Google Earth |
|
|
If you like this page, you can help us by clicking on our latest research paper in nature geoscience It is on CO2 release from continental shelves and you can read it for free here It has a wonderful graph that shows the relation between CO2 and sea-level during the last 800,000 years. This figure shows impressively how crazy our current CO2 levels are. You don't have to be a scientist to predict, where sea-levels might end up soon. |
 |
|